in Case study
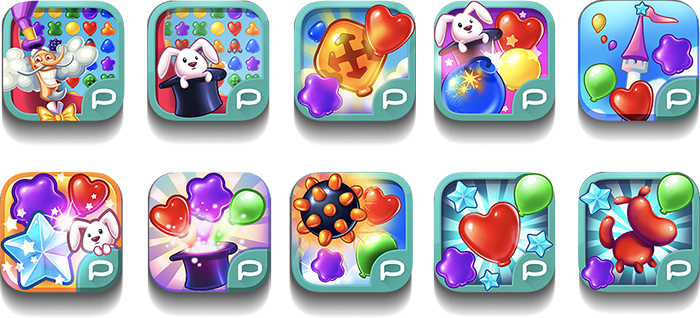
Icon Designing and A/B Testing
We selected the three most promising icons to A/B test from ten designs.
Testing Results
The new icon designs did not significantly change the install rate. However, it’s always important to optimize the icon as it has a strong impact on both the “Featured” and “Ranking” store pages.
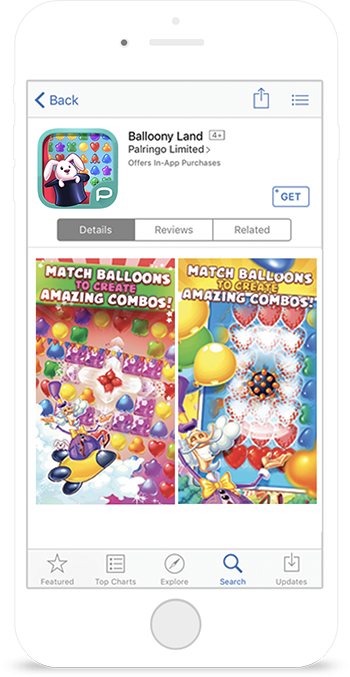
cvr: 7.03%
526 users
cvr: 6.16%
584 users
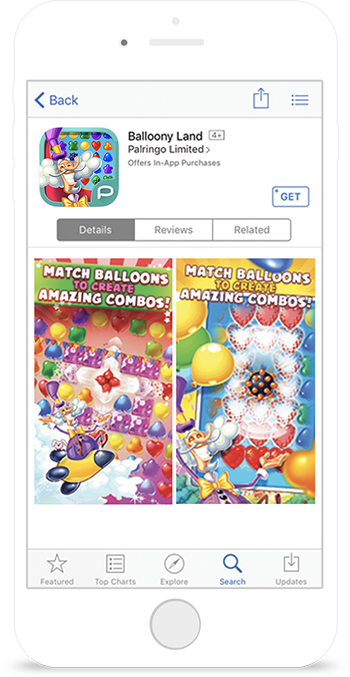
cvr: 6.11%
524 users
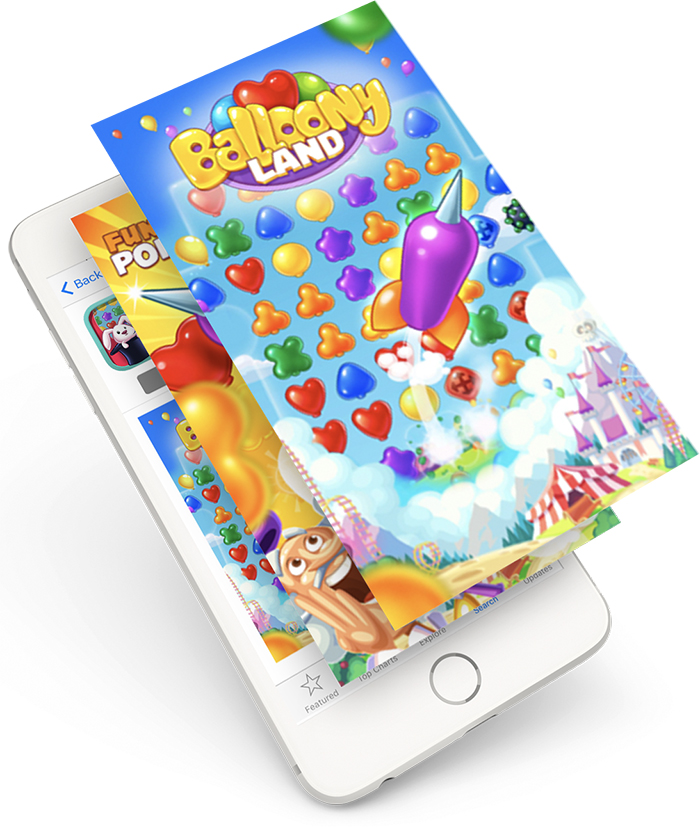
A/B Test Iterations with New Screenshots
We decided to improve screenshots and to focus mostly on the first two as this is what draws the most attention from users browsing the app store page.
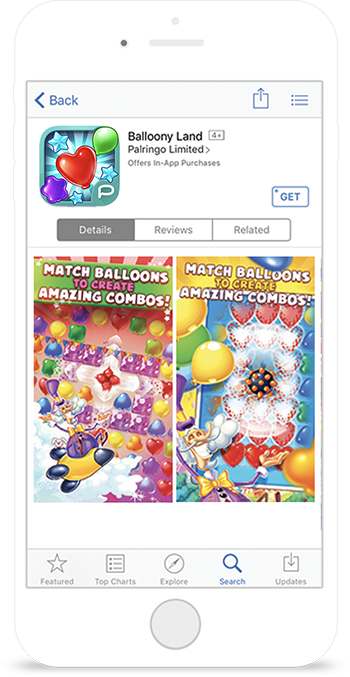
We created multiple App Store landing page variations using the winning icon. Below are three examples, including the winning combination of icon and screenshots.
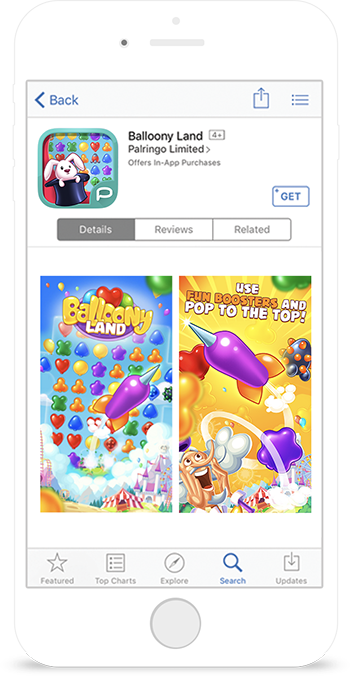
cvr: 40.21%
97 users
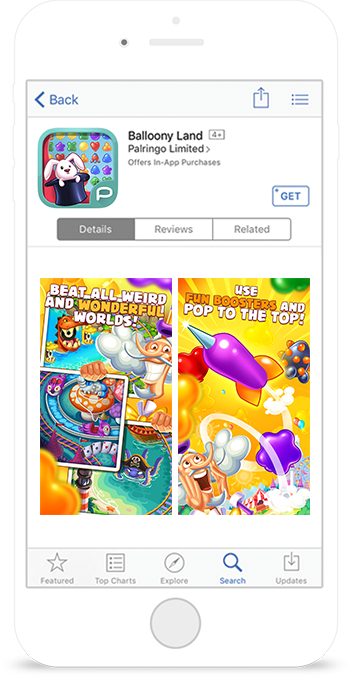
cvr: 38,17%
117 users
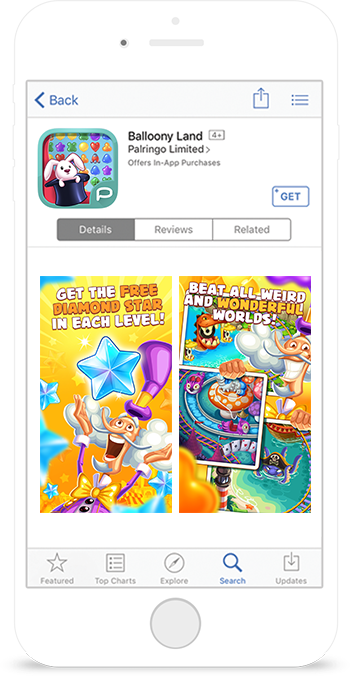
cvr: 36.26%
91 users
RESULTS
BEFORE ASO
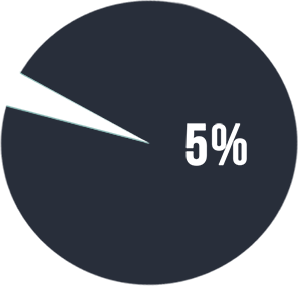
We drove hundreds of users from Facebook to the initial landing page and got disappointing results. Only 5% of users showed an intention to install the app.
AFTER ASO
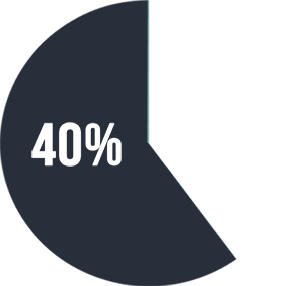
The impact of the A/B test is astonishing: 40% of the users we drove from Facebook showed an intention to install the app.
- The Amount of users who showed an intention to install the app
IN THE CASE OF BALLOONY LAND, WE MANAGED TO LOWER THE COST OF ACQUISITION BY
90%


